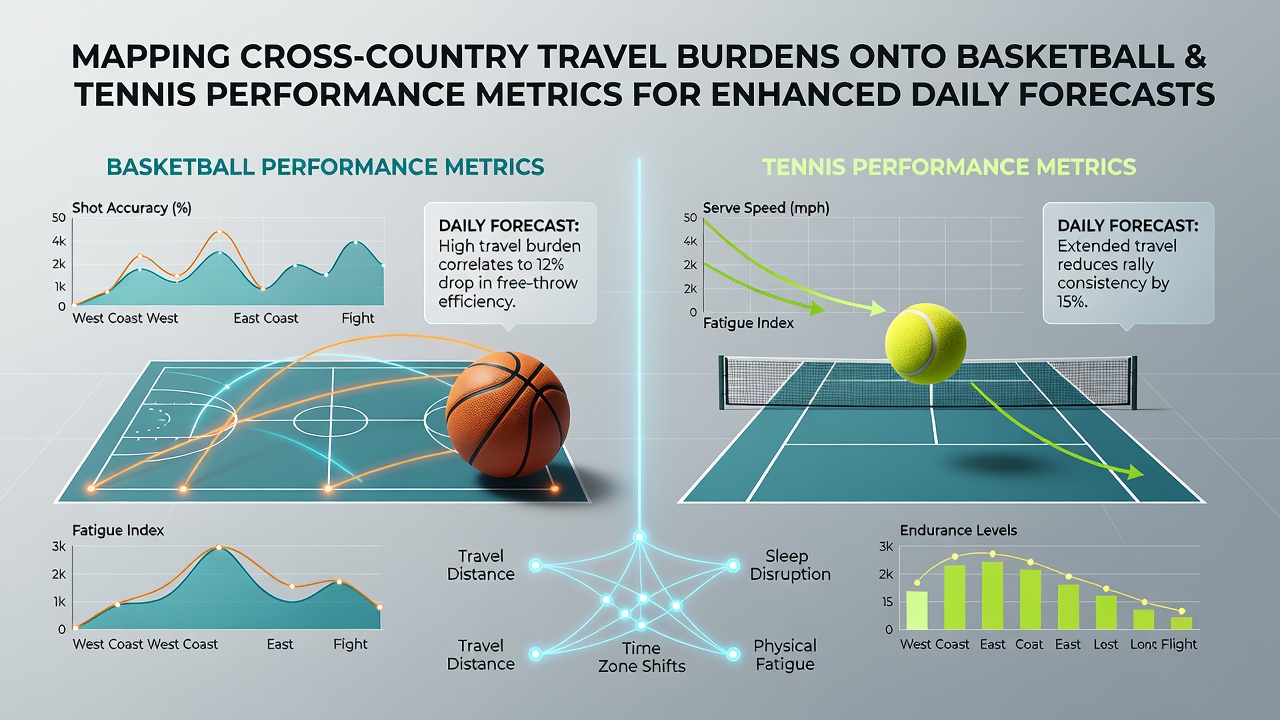
Mapping Cross-Country Travel Burdens onto Basketball and Tennis Performance Metrics for Enhanced Daily Forecasts
Cross-country travel creates measurable disruptions in athlete recovery cycles and performance outputs across professional basketball and tennis schedules, with researchers documenting consistent patterns in statistical declines that follow extended flights and time zone shifts. Data from league tracking systems show that NBA teams covering more than 2,000 miles in a 48-hour window experience average drops of 4 to 7 points per game in offensive efficiency, while tennis players crossing multiple zones report reduced first-serve percentages in opening matches of new tournaments.
Travel Demands in Basketball Schedules
Basketball rosters navigate dense domestic calendars that frequently pair back-to-back games with coast-to-coast flights, and league records indicate these sequences correlate with elevated turnover rates and lowered three-point accuracy during the second contest. Analysts at sports science centers track variables such as flight duration, sleep displacement, and cumulative mileage, then align those figures against box-score outputs collected over multiple seasons. One dataset compiled by university researchers revealed that West Coast teams visiting Eastern venues on short rest posted win percentages 12 points below their season averages, a gap that narrowed when recovery windows extended beyond 72 hours.
Performance Metrics Affected by Distance
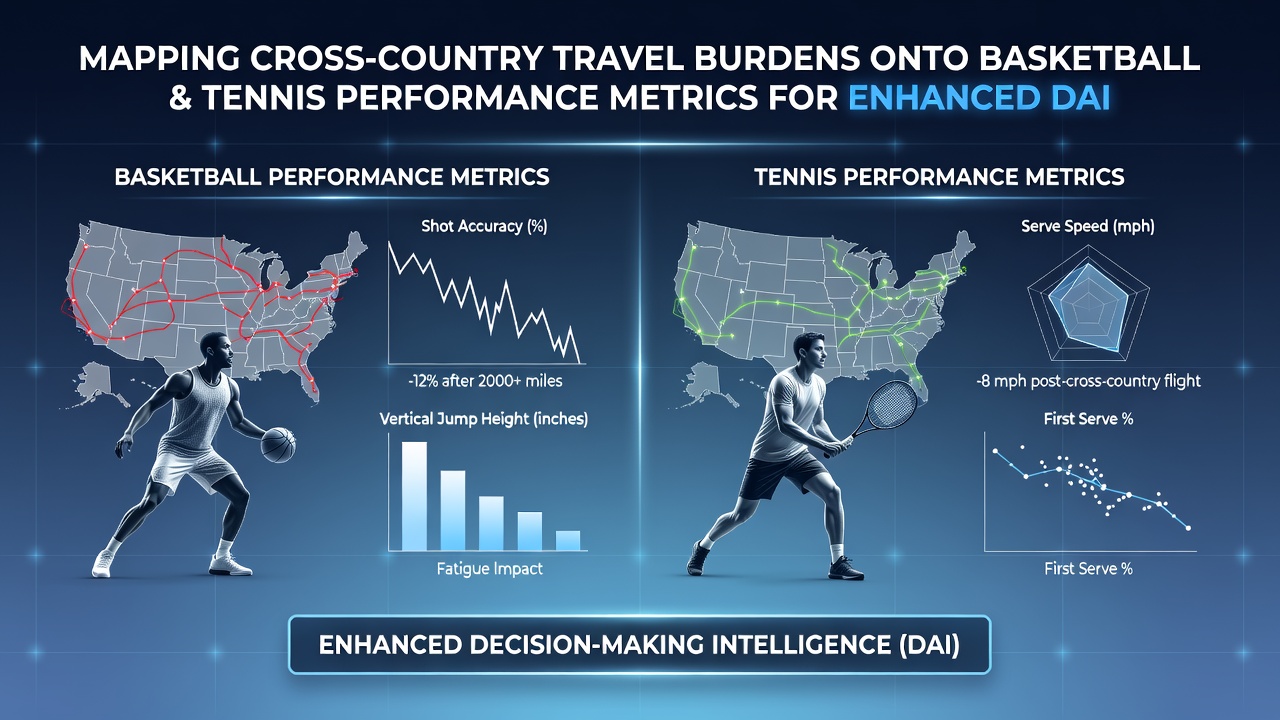
Key indicators include points allowed per possession, rebounding efficiency, and assist-to-turnover ratios, all of which shift measurably after long-haul segments. Observers note that these changes appear most pronounced in players logging heavy minutes, where heart-rate recovery data collected via wearable devices shows delayed return to baseline levels. Mapping tools combine GPS flight logs with performance databases to generate adjusted projections that account for fatigue accumulation rather than relying solely on historical averages.
Tennis Tour Logistics and Player Responses
Tennis circuits span continents within weeks, placing athletes on successive flights between North American hard courts, European clay events, and Asian swing stops, and performance logs indicate serve speed reductions of 3 to 5 percent in matches played within 24 hours of arrival. Studies from the Australian Institute of Sport have quantified jet-lag effects on reaction times and stroke consistency, linking greater longitude changes to higher unforced-error counts during early rounds. Daily forecast models incorporate these variables by weighting recent travel distance against surface-specific win rates, producing probability estimates that reflect both physical recovery timelines and court adaptation periods.
Integrating Data Layers for Forecast Accuracy
Forecast systems merge travel metrics with on-court statistics through regression frameworks that assign coefficients to distance traveled, time-zone differential, and days between events. Canadian research teams at McGill University have tested models that adjust baseline player ratings downward after transcontinental journeys, then validate outputs against actual match results across multiple Grand Slam qualifying draws. The approach yields tighter error margins compared with unadjusted projections, particularly for second-week matches where cumulative fatigue compounds. In August 2026, the ongoing hard-court swing provides fresh datasets as players navigate the North American portion of the calendar before shifting to Asian tournaments later in the month.
Case Examples from Recent Seasons
League statisticians documented one Western Conference basketball club that lost four consecutive road games after a three-game, five-day road trip spanning 4,800 miles, with defensive rebound percentages falling below 70 percent in each outing. Similar patterns emerged in tennis when a top-ranked player dropped opening-set service games at a higher rate following a 14-hour flight from Melbourne to Indian Wells. These instances supply calibration points for algorithms that now factor travel vectors into daily updates.
Future Refinements in Modeling
Continued collection of biometric data from players and expanded GPS integration promise further precision, while academic groups continue publishing validation studies that compare forecast outputs against observed outcomes across full seasons. Organizations such as the International Olympic Committee have released position statements on athlete travel health that supply additional reference points for metric weighting. The resulting forecasts deliver updated probability ranges each morning, reflecting overnight schedule changes and revised travel burdens.
Conclusion
Mapping cross-country travel burdens onto established performance metrics supplies a structured method for refining daily forecasts in both basketball and tennis, with evidence drawn from multiple seasons demonstrating measurable statistical shifts tied to flight distance and recovery intervals. Continued refinement of these models supports more accurate projections as new data streams become available.