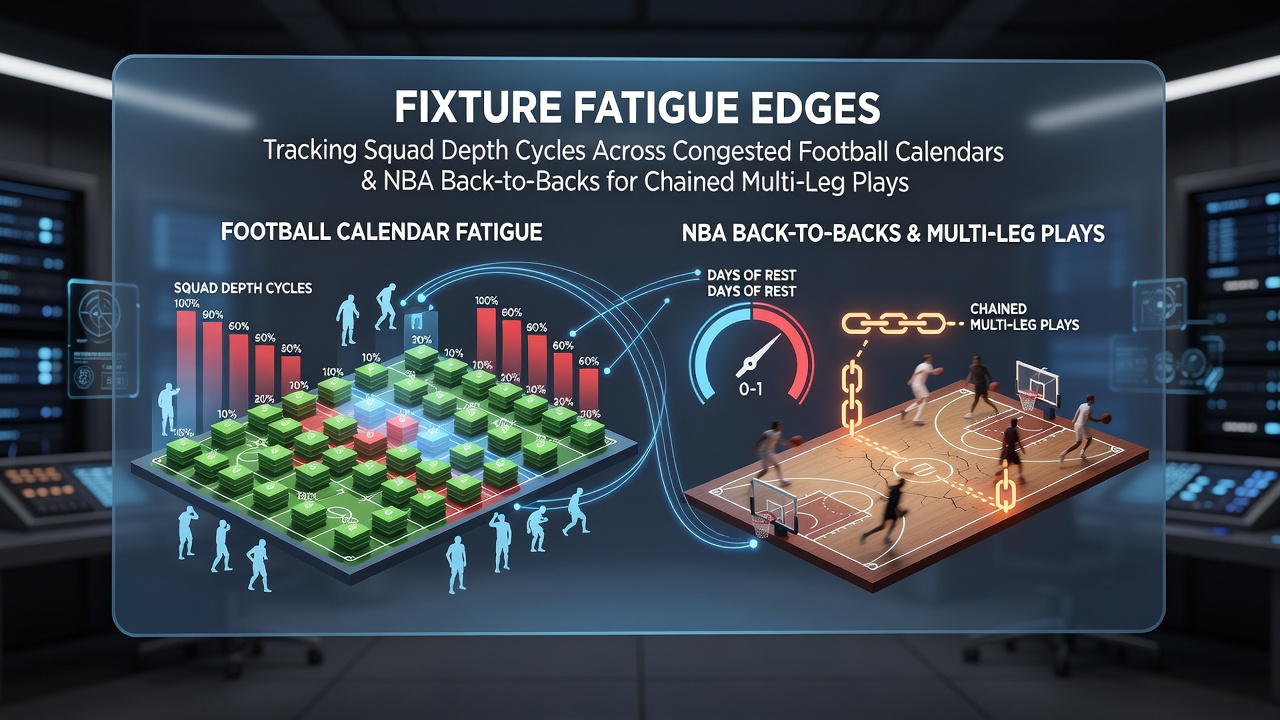
Fixture Fatigue Edges: Tracking Squad Depth Cycles Across Congested Football Calendars and NBA Back-to-Backs for Chained Multi-Leg Plays
Fixture congestion shapes performance patterns across major football leagues and the NBA, where dense schedules force teams to manage player availability through rotation and recovery cycles, and data from these patterns feeds into chained multi-leg accumulator strategies that combine outcomes from multiple matches.
Football Calendar Pressures and Squad Rotation Data
European domestic leagues plus UEFA club competitions create clusters of matches within short windows, with the Premier League, La Liga, Serie A and Bundesliga each scheduling 34 to 38 fixtures plus cup ties and continental games, while the NCAA athlete wellness reports document similar load management issues in collegiate basketball that mirror professional patterns. Teams respond by cycling central defenders, midfield anchors and wide attackers to preserve freshness, and performance databases record measurable drops in distance covered and pass completion rates after three matches in eight days.
September 2026 brings an additional international break that overlaps with early domestic rounds, compressing recovery time for players returning from national team duty and increasing the frequency of squad adjustments tracked by performance analysts.
NBA Back-to-Back Scheduling Patterns
The NBA regular season packs 82 games into roughly six months, producing dozens of back-to-back sets and occasional three-in-four-night stretches, with official league schedule releases showing that road back-to-backs occur at higher rates for teams in larger markets. League-wide tracking reveals that teams on the second night of a back-to-back post lower shooting percentages from beyond the arc and reduced rebounding efficiency compared with rested opponents, and these figures appear consistently across multiple seasons.
Measuring Squad Depth Cycles
Depth charts evolve through the season as coaches rest starters during lighter midweek fixtures or after international windows, and injury surveillance systems record elevated soft-tissue issues when minutes exceed established thresholds. Analysts compile rolling averages of player availability, substitute impact minutes and bench scoring output to identify periods when depth becomes a limiting factor, and these metrics update weekly as lineups are released.
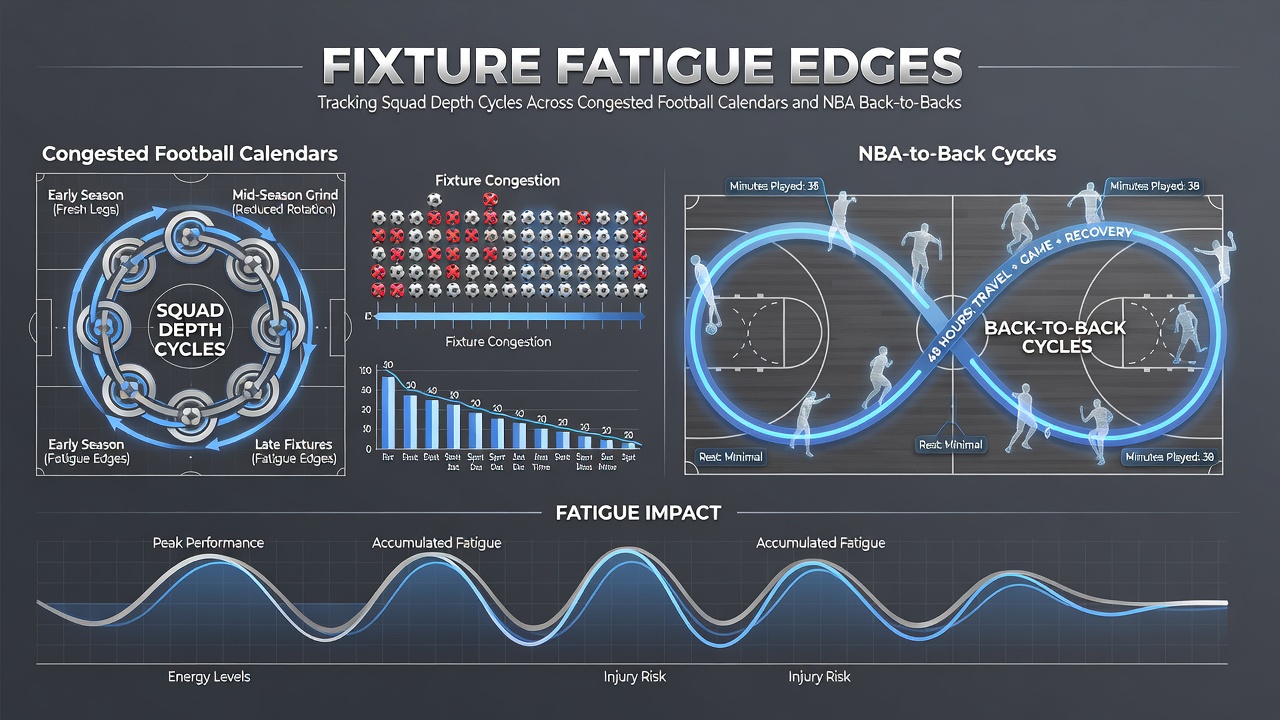
Researchers at the Australian Institute of Sport have published longitudinal studies on load accumulation that align with observed NBA and European football trends, showing that cumulative match exposure correlates with subsequent availability rates. Teams with broader rosters maintain steadier output across congested blocks, whereas shallower benches exhibit sharper variance in key performance indicators such as expected goals created or defensive stops.
Linking Fatigue Metrics to Multi-Leg Accumulators
Accumulator builders combine selections across football and basketball by aligning fixture lists that share similar congestion profiles, for instance pairing an NBA road back-to-back with a midweek European football match involving travel. Publicly available schedule data and rotation reports allow construction of chains that account for rest differentials, and historical outcome records indicate that rested sides cover spreads or totals at different rates than fatigued opponents. Observers note that September 2026 schedules include overlapping blocks where several leagues face compressed calendars simultaneously, creating windows for coordinated selections across sports.
Betting platforms publish pre-match and in-play markets that reflect these dynamics once lineups and travel reports surface, and volume data from exchange platforms shows increased activity on totals and player props when fatigue indicators align. The process remains data-driven, relying on verified schedule releases, injury reports and historical performance splits rather than narrative speculation.
Conclusion
Fixture fatigue tracking centers on verifiable scheduling density, rotation frequency and performance differentials across football and NBA calendars, supplying structured inputs for chained multi-leg plays that span multiple dates and sports. September 2026 illustrates how overlapping international and domestic obligations intensify these cycles, while league-published statistics and independent research continue to supply the raw material for such analysis.